Whether You Do Or Weather You Don’t. Or WUDOWUD. Eh?
The British Isles has a tempestuous relationship with the weather. Enough different types of weather hit these shores and more extreme weather seems to be the new normal. So what? Well, what if you could take advantage of our growing accuracy in weather forecasting to respond more pro-actively to a pending weather event? What if you know that by being smarter about how you respond to the weather means you can save money, time, resources and possibly even a life.

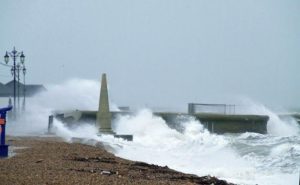
Southsea Seafront Storm Copyright G. Emson Kindly used with permission
After all, the destructive impact of a single event can cause millions of pounds worth of damage. The impact weather has on our landscape in terms of felled trees, flooding and icy roads has been with us since time began. With climate change the incidents of extreme weather are likely to increase in frequency as well as ferocity. This is not avoidable.
Therefore, how best to adapt and be smart about a response to this type of weather will be one way of relieving the pressure on the finances, the infrastructure and local resources. This is the essence of Whether you do or Weather you Don’t. Or.. WUDOWUD for short.
The concept for WUDOWUD came about because KnowNow attended a Big Innovation Centre event supported by the STFC (Science & Technology Centre). Much to our surprise the WUDOWUD concept paper that I wrote actually won! So we have the exciting pleasure of using open data focused on Hampshire and the Isle of Wight to prove that the weather does cause bad things to happen! No surprises there then!
Using the Hartree lab’s brand new supercomputer, which for those interested is an IBM Blue Gene/Q system with 98,304 cores and a total of 96 TB of distributed memory across the system! Now this wee computer should be in a great position for us to run a couple of interesting thought experiments…
How it works
WUDOWUD is broken into two distinct phases. The first one is to prove that a correlation can be positively identified between the weather event and then stuff happening due to that weather in a specific location. (As long as it is in Hants!). We are looking at data from the last 14 years. With part one identifying a correlation (2000 to 2006) and part 2 then validating this correlation (2007 to 2014). Phase two is then working with experts in the emergency services, Environment Agency and the local council response teams in determining whether a proactive response could lead to a better outcome.
Over the last few weeks we have been working on a data catalog from key providers – such as: the Met Office, the Environment Agency, Hampshire Fire & Rescue, the NHS, Hampshire County Council and Ordnance Survey. As well as assembling the interested parties for a workshop on the 29th of September, plus starting the preparation on the ground for a bit of super computer muscle flexing.
I believe based on my experience in systems management, I expect we can generate potential/theoretical savings of up to 30%. Whatever we discover and do next the results will be first published in the new Hants Hub. Thus helping to make Hampshire a more informed and ‘smarter’ place. However, the trick is actually implementing the new recommended responses and procedures on the ground. That story will be the subject of another blog post. So watch this space.
Thanks for reading. Chris.


Trackbacks/Pingbacks