Great ideas that require lots of data are difficult to execute. The original rationale for a project can often get lost.
Realising a digital twin and smart city project is no different. They too require vast amounts of data, and with many stakeholders and competing interests knowing what to do first, or even next, can be tricky.
Why is this? Often it is because the data required to deliver success only has value to a single entity. This is due to the way data ownership is organised. Execution is more difficult when the responsibility for data exploitation is not directly aligned with ownership.
When this happens, the true benefits of digital twin/smart city projects cannot be realised and value is left on the table. The project might not exit the proof of concept or even the feasibility stage. The identified benefactor can seek a better return on investment via other projects. The so-called ‘hangers-on’ disappear and the idea retreats into the back of the cupboard—no doubt to be dusted down again in a few years.
The reality is that Digital Twin and Smart City projects, by their nature, have multiple stakeholders. They are complex and complicated. As such, it is very unlikely one single benefactor exists. If they did, the investment would have been made and realised already.
How can this situation be avoided in the first place?
For a start, when discussing value, it is important to have two distinct steps.
Step one: Ringfence the cost. Create ownership and contracting vehicles to own the cost and the shared responsibility of exploitation.
Step two: Have a multi-dimensional, multipath plan with multiple activities executed over different time frames to exploit the data.
We will focus on step two—how to capture and exploit data value.
Where to start?
A new data canvas method has been created by the Energy Systems Catapult in conjunction with KnowNow Information. This data canvas takes projects on a journey of data requirements discovery through a series of iterative phases, conducted in workshop conditions. It captures a true picture of what data is required from a project to deliver successful outcomes.
Multiple Dimensions
Projects will have many outcomes identified. Stage one of the data canvas identifies the data stakeholders and the outcomes they want to seek. At this point in the data canvas journey, it is possible to put a metric of value against a data outcome.
Note, however, that different units of measurement are not always transferable and comparable. Be cognizant of the limitations of one project sharing datasets with others. There are technologies (data brokers) that will translate and transform datasets so they are comparable across different projects.
Overall Value
Each of those outcomes identified stakeholders, a measure of success and value that can be realised. The collection of these outcomes becomes, in turn, the overall realisable value for the project. Some of the values will be shared with multiple stakeholders; others will be standalone. The graphic below shows this model.

The total size of the overall project value (represented as the green bounded shape) is way bigger and a more attractive investment. However, how all the stakeholders are organised (as distinct entities) means recognising this total value is difficult and requires more effort.
The key is being able to measure, at the project level, the totality of the value generated for all stakeholders and use cases – even when not all stakeholders have an equitable share.
Differences will always exist in relative stakeholder value, as seen in the differing sizes of the blue bubbles above. Participants stay involved however because the sum of all parts is greater than one. The project community can deliver outcomes that otherwise would not happen.
Even if one participant has greater input costs than another, and even if the benefits of the outcome are shared, the collaboration outcome is enough of an incentive to retain the involvement of all participants.
This means measuring value on outcomes has to have different perspectives.
- The micro (individual stakeholder level)
- The grouping of stakeholders around an outcome
- The overall collection of outcomes for the entire project.
Capturing value and the economic value of data
In stage five of the Data Canvas, we look at value creation. Where value is accrued depends on who is assessing value and what they determine to do with it. To help measure the value, stage five of the Data Canvas is used to identify the impact by providing a worked example. Once a measurement of value is determined, a number can be attributed to it.
Data will change value over time, according to the current use case. Understanding the role of each data element over time will help projects put a suitable value on the data they generate.
The graphic below describes the relative value of energy data over time before the ‘event horizon’. This is the point at which the data goes from high value to minimal or no value.
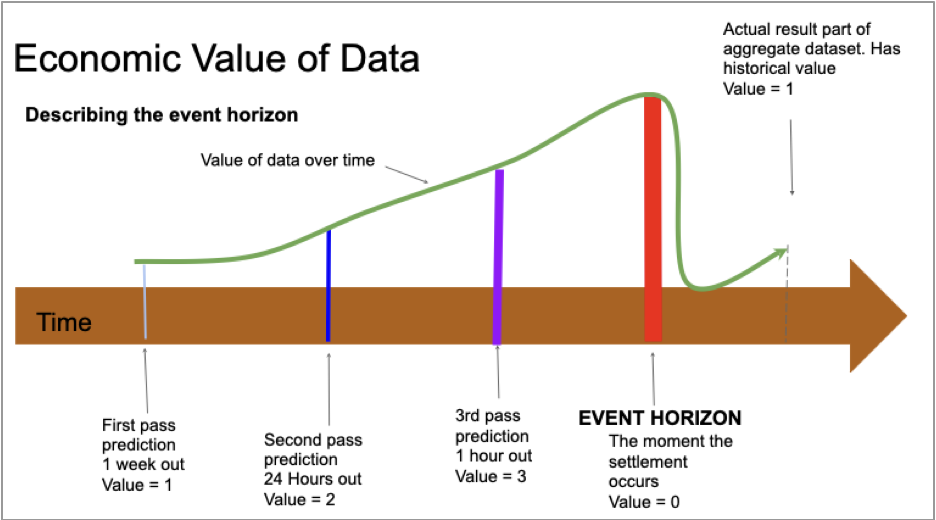
The economic value of data graphic. Taken from https://es.catapult.org.uk/brochures/energy-data-management-canvas/
The data owner (i.e. the energy generator) places a high value on data that is just-in-time and relatively accurate. The challenge is that most actors involved in energy, be that the generator, the consumer, or the trader, are all working to different time thresholds.
The time threshold is defined as the amount of time it takes to change behaviour. This could be the time taken to benefit from the energy being created, or a change in price which incentivises the consumer to consume, generate, or store energy.
Motivations and thresholds differ according to the actor. The season, the weather (current or forecasted) and the prevailing conditions of the user, all impact the time at which the die is cast – no matter what further nudges are provided. No matter the persuasion, there is little hope of a change in outcome.
Considering this will help projects identify what data is useful and when. This is because the data can be normalised across time.
There are three key moments in time:
1. The pre-event horizon. This can be subdivided into several prediction passes.
2. The actual event horizon.
3. After the event horizon, amalgamated data provides evidence for trends which can help make predictions more accurate.
In the model above, the initial prediction of data value is taken at one week out. This could be taken at any period, but in this case, one week gives some confidence over the weather forecast which is important for solar and wind-based energy generation. The weather drives patterns of user behaviour and therefore demand. This is the time to consider offering incentives to influence user behaviour. For example, timely financial incentives can maximise the gain for the generator, storage of energy, or gain for the consumer.
The second data pass is made when twenty-four hours out. At this point, the weather is likely to be more accurately predicted. Plans are a little less fluid and commitments are made. The ability to influence is reduced, but the overall value of the data is probably greater. With more knowledge and less variability in the expected outcome, there is less risk. Resources can, therefore, start to be provisioned, be they for storage, generation, or consumption.
The final pass is made close to the event horizon. In our example, it is one hour out. This enables interventions to be made with a more complete understanding of the current situation and verification that actions previously initiated are appropriate.
Conclusion
When it comes to your digital twin or smart city project and want to capture the data value, here’s what you have to do:
- Recognise that it is a collaborative and multi-entity effort.
- Use the data canvas to build the data story.
- Use measures other than cost to capture and articulate the value of a project.
- Keep in mind the ‘Event Horizon’ – and beyond!
I love talking about client smart city and digital twin projects. Get in touch if you want to see how a data canvas workshop could help you – chris.cooper@kn-i.com
This is a copy of the FIVR edited version – 13/11/20
Trackbacks/Pingbacks