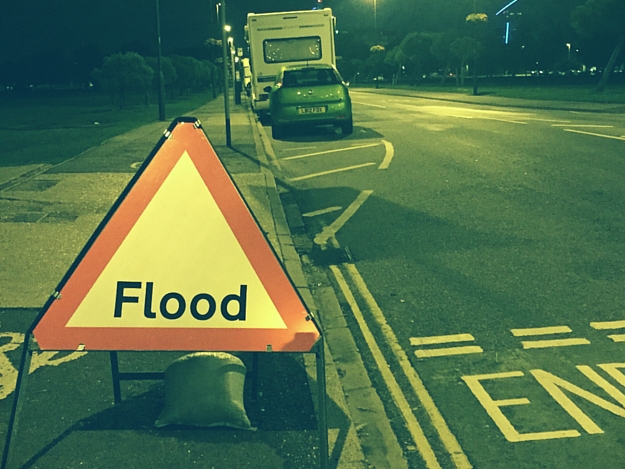
It is amazing how in early December, you wouldn’t read any flood news at all – the next week, and ever since, it is almost all that is in the news and our Twitter feeds are awash with alerts, warnings, and heartbreaking stories from those affected. The floods that affected the UK after Storm Desmond (a name that would grace a character from any U.S. law drama), have tested the resiliency of some areas to the absolute limit, sometimes beyond.
What happens at the moment

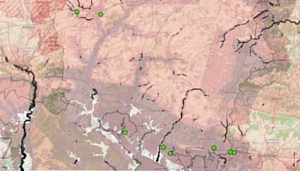
Warning map for Storm Desmond
When there is a forecast for heavy rain for any area in the UK then a resiliency team is usually activated who will try to work out which areas may be affected and deploy resources accordingly. Usually, this is done on the basis of local expertise and known trouble spots.
The problem at the planning stage is that the forecast for rainfall is not particularly granular and the effects of localised rainfall on a particular area is not usually well known. This can lead to poor planning decisions being made, not through any fault of the operators but because there are too many variables.
At the service delivery stage, it is often a case of first come first served. In the best case, some of the resources are diverted to known breakpoints which are likely to be at severe risk. In the worst case, essential resources are deployed in inappropriate locations where those resources have little chance of making an incremental improvement in the outcomes for those affected.
Building a proper plan
So what does success look like in planning for a flood? Firstly we have to accept that flood events are likely to occur and that the problems will depend on a large number of factors. We then need to decide where flood prevention should be prioritised and where flood mitigation should be practiced.
The common way to prioritise during flood events is by risk mapping. The flood risk maps tend to be fairly static and represent risk in terms of years in between maximum flood extent. Over a period of thousands of years, the statistical likelihood of flooding in any particular place is possibly accurate but as we have seen this year, it is entirely possible to have multiple ‘100 year events’ in a very short space of time.
Preparing for flooding in Southsea, Hampshire
Another failing of the current risk maps is in treating whole areas as if they have an equal acceptance of risk. It is obvious that there can often be critical infrastructure within an area that will not have the same acceptance of risk profile as the surrounding area. At KnowNow we are just beginning to discuss with some of the owners of nationally important infrastructure how we might be able to help them to assess how flooding causes risk to individual elements of this infrastructure.
Of course the biggest question, and one that will be particularly pertinent to those who have suffered in Yorkshire, Lancashire, and Scotland over the last couple of weeks, is what happens when the ‘average’ event is exceeded? Building a model that can anticipate larger volumes of rain is crucial during this period of global warming and more chaotic weather.
It is possible to create a dynamic flood risk map based on available data using modern predictive analytics tools. There is available data from the Environment Agency Open Data, and the weather services such as the Met Office or our own chosen provider, Forecast.io. Increasingly emergency service providers and the local authorities are making open data available. Our head office is based in Hampshire and the County Council here created the Hampshire Hub, an open data repository that contains much of the data that we used to create the Flood Event Model.
Flood Event Model
Flood Event Model tries to predict where flooding will affect people and infrastructure. Initially completed as a proof of concept based on Hampshire in the UK, it is now being expanded to cover other areas. So far there is an 85% accuracy in predicting where flooding will intersect infrastructure to the detriment of human life. Most of this is based on the road and rail infrastructure and uses historical data from the fire and rescue services to work out how much rain it takes to increase the likelihood of the need for rescue. It is anticipated that the accuracy figure will increase with additional paid-for data sets.
Sample output from Flood Event Model
Flood Event Model is particularly good at helping you to decide where scarce flood mitigation resources should be deployed by using ‘hyperlocal’ data to create a risk profile for every 50m square within a region. This will reduce the chance of deploying these resources within an area that is unlikely to be affected or where deployment would make little difference to the outcome.
The slight limitation of the model is that currently, it does not take into account any long-term damage to infrastructure, defences, and land which may mean that it is not possible to anticipate the effects of these dramatic failures. Examples could include non-clearing of culverts, pump failures, or lack of river dredging. It is hoped that in time these data sources could also be added to the model. At the moment, however, the data is not collected.
We are hopeful that we will get funding to further develop Flood Event Model in the near future. Several candidate areas have put themselves forward and are trying to gather the necessary data. If you think you can help, either by providing ideas for development or sources of funding, then we’d be all too happy to talk. Comments would be appreciated below!
Thanks for reading,
David Patterson
@david_patto
Postscript
It is noted that this week the Prime Minister spoke about spending £2.3bn on flood defences over the course of the current parliament with an additional £40m being spent on Yorkshire’s specific problems. It seems he agrees with me that ‘a complete rethink is needed’. The change to a predictive analytic system based on current and historical data would provide this rethink.
To create the proof of concept for Hampshire cost £50,000. An estimate for the entire UK is around £1m. This would allow much of the rest of the spending to be focussed on areas where it would make a difference, prioritise the infrastructure that will actually help, and also identify currently unaffected areas where increasingly chaotic weather might begin to cause new problems.
We are here ready to help.
Trackbacks/Pingbacks